
Kasper Thomsen
Senior Data Analyst & Engineer
Barcelona-based expert with 8+ years turning complex data into actionable insights. Specialist in SQL, BigQuery, and Python.
Senior Data Analyst & Engineer
Barcelona-based expert with 8+ years turning complex data into actionable insights. Specialist in SQL, BigQuery, and Python.
Scroll through the stack to reveal detailed impact

PAYHAWK
2025 - Present
Table
Dependencies

HP
2023 - 2025
Global Data
Models
HP
2022 - 2023
Internal
Innovation

VITEC
2020 - 2022
Technical
Roadmaps
VITEC
2018 - 2020
Automated
Workflows

Aarhus University | 2017 – 2019
Specialization in Forecasting, Text Analytics, and Data Mining.

NTU Singapore | 2016 – 2016
Focus on:
Aarhus University | 2014 – 2017
Thesis on consumer behavior in autonomous vehicles (Grade: A).
Click a project to explore the architecture
Built an ecosystem of 130+ automated devices via Home Assistant. Integrated a locally hosted Large Language Model (Ollama) for intuitive natural language voice control.

This ongoing project integrates Ollama with Home Assistant's voice pipeline, allowing conversational control over 130+ privacy-focused devices.
Key Features:Architected robust data models using Looker & LookML for massive global datasets. Enabled deep behavior analytics and stakeholder dashboards for HP's scan ecosystem.

Built massive global behavior models for HP scan devices, providing critical insights for product teams via PowerBI.
Objectives:Developed a 2D game using Phaser.js and Vite. Explored practical application of LLMs (ChatGPT, Suno, Gemini) for AI-driven generation of game assets and music.
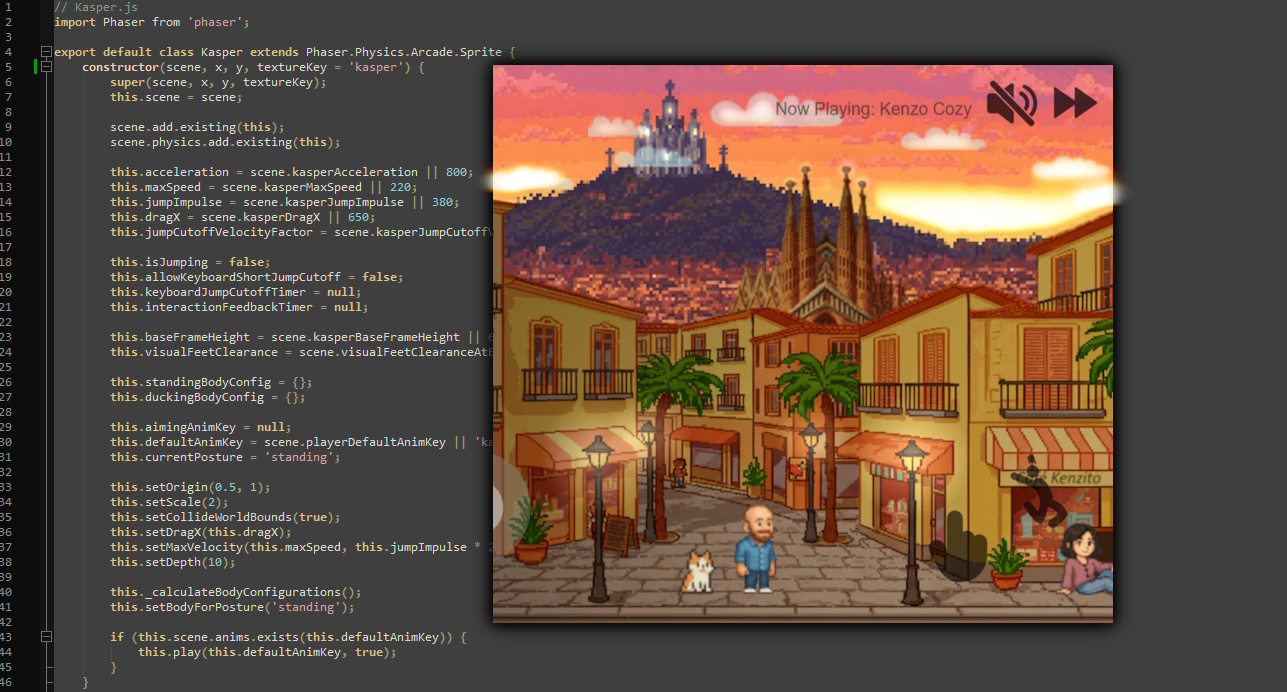
Built from scratch to learn game physics loops while applying advanced generative AI models for music and sprites.
Learnings:
Barcelona / Global Remote
I'm always open to discussing new data challenges, AI integrations, or technical leadership opportunities.
Send a Message